What Is Earned Value Management? How to Measure Real Project Progress
Ben Walker
Written for Drum
In This Article
What Is Earned Value Management A Practical Guide
Earned Value Management (EVM) is a project management method that gives you an honest, real-time answer to the most critical project questions: Are we on track? and Are we on budget? It acts as a health check by combining your project’s scope, schedule, and costs into a single, unified view.
Understanding What Earned Value Management Really Is
Have you ever managed a project where the budget report looked fine, but you had that nagging feeling you were falling behind? It’s a common problem. Traditional budget tracking only tells you how much money you’ve spent. It doesn’t tell you what you actually got for that money.
This is the exact problem Earned Value Management was designed to solve.

Instead of looking at cost and schedule as separate line items on a spreadsheet, EVM integrates them. It encourages you to compare the work you planned to do against the work you’ve truly completed and what you’ve spent so far. This approach gives you objective, data-driven insights into your project’s real performance.
A Simple Deck-Building Analogy. Let’s make this real with a friendly, practical example. Imagine you’re building a deck in your backyard. Your plan is to finish the whole thing in four weeks for a total budget of $4,000.
At the two-week mark—that’s 50% of your timeline—you check your bank account and see you’ve spent $2,000.
If you were only tracking the budget, you’d probably think, “Great! I’m exactly on track.”
But with an EVM mindset, you ask a much better question: “Okay, I’ve spent 50% of my money, but have I actually completed 50% of the work?” You look outside and realize only the deck’s foundation and frame are done. That’s maybe 25% of the total job. Suddenly, you have a crystal-clear insight: you’re way over budget for the work you’ve finished and you’re falling behind schedule.
Earned Value Management isn’t just about tracking dollars spent; it’s about understanding the value delivered for every dollar. It connects your financial spending directly to your physical progress.
This simple shift in perspective is the core of EVM. It originated back in the 1960s with the U.S. Department of Defense to get a better handle on large, complex contracts. Today, its effectiveness is proven across countless industries, with studies showing projects using EVM report 20-30% fewer budget overruns. You can discover more about its project management benefits on epicflow.com.
It’s a practical framework any project manager can use to make smarter, more informed decisions.
Understanding the Three Pillars of EVM
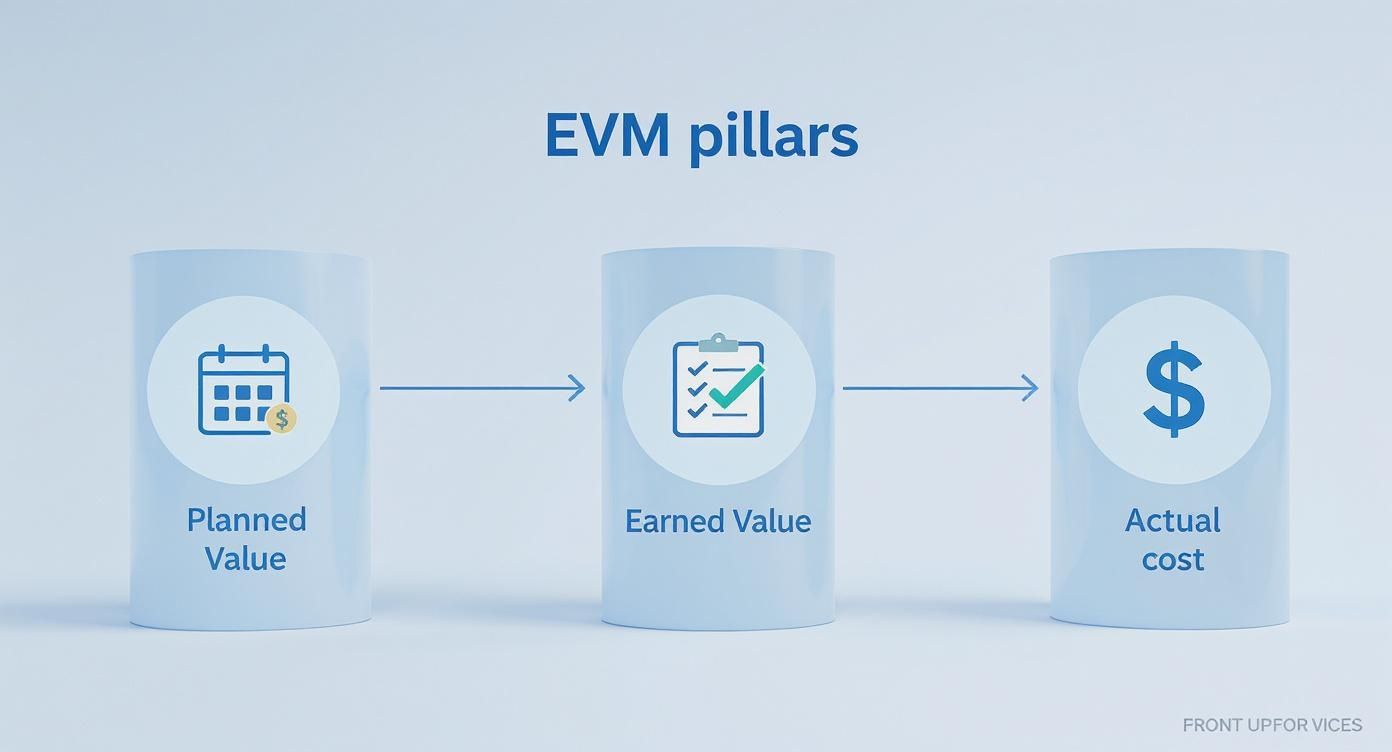
To get real value out of Earned Value Management, you first need to get comfortable with its three core metrics. Think of them as the vital signs for your project’s health. They work together to give you a complete picture that looking at your budget or a simple progress bar can never provide.
These three pillars are Planned Value (PV), Earned Value (EV), and Actual Cost (AC). Let’s walk through them with a straightforward, friendly example.
Imagine your agency is building a new software feature for a client. The whole thing is scheduled to take three months with a total budget of $30,000.
Planned Value (PV): Your Project Roadmap. First up is Planned Value (PV). This is simply the authorized budget for the work you planned to have done by a certain date. It’s your baseline, your roadmap. PV answers the question, “How much work should we have completed by now?”
For our software project, we’ll assume the work is spread evenly across the three months. So, at the end of Month 1, your plan says you should be one-third of the way through.
- PV = $10,000 (one-third of the total $30,000 budget)
This number sets the expectation. It’s the benchmark against which you’ll measure everything else that follows.
Earned Value (EV): Your Actual Progress. Next, we have Earned Value (EV). This is where the magic happens. EV represents the value of the work you’ve actually completed, measured against your original budget. It answers the crucial question, “How much of the planned work did we really get done?”
At the end of Month 1, you take a hard look at your team’s progress. They nailed all the design work, but only managed to finish half of the scheduled development tasks. After a quick, honest assessment, you figure you’ve only completed about 80% of the work planned for the first month.
- EV = $8,000 (80% of the $10,000 planned value for Month 1)
This metric is so powerful because it ties your real-world progress directly back to your budget.
Actual Cost (AC): The Final Bill. Finally, there’s Actual Cost (AC). This one is exactly what it sounds like: it’s the total amount of money you have actually spent to get the work done so far. It answers the simple question, “How much have we paid out?”
You pull up the financials for Month 1, adding up team salaries, software subscriptions, and other expenses. The total comes to $9,000.
- AC = $9,000
Now you have a complete, objective snapshot of your project’s health. You planned to get $10,000 worth of work done (PV), you actually got $8,000 worth of work done (EV), and it cost you $9,000 to do it (AC).
With just these three numbers, you can see with total clarity that you’re behind schedule (EV is less than PV) and over budget (AC is more than EV). This is the core power of EVM. It transforms vague feelings about a project into cold, hard, actionable data.
Putting the EVM Formulas into Practice
Okay, so you’ve got a handle on the three core pillars: Planned Value (PV), Earned Value (EV), and Actual Cost (AC). Now for the fun part! The real magic of EVM happens when you start plugging these numbers into a few simple formulas. This is where the raw data starts telling a powerful story about your project’s health.
Think of EVM’s foundational pillars like this: you have what you planned to do, what you actually did, and what you actually spent. These three inputs are the bedrock for every other calculation we’re about to make.
Each of these pillars gives you a different piece of the puzzle. When you put them together, you get a crystal-clear picture of what’s really going on. Let’s kick things off with the most direct calculations: variances.
Checking for Variances. Variances are your first, most immediate signal. They tell you in concrete dollar amounts just how far you’ve drifted from the plan. Think of them as a quick red or green flag on project health.
-
Cost Variance (CV): This one instantly shows if you’re over or under budget. It answers the simple question, “Are we getting the value we paid for?” The formula is CV = EV - AC. A positive number is great (you’re under budget), while a negative number means you’re bleeding cash.
-
Schedule Variance (SV): This formula tells you if you’re ahead of or behind your timeline, but it’s expressed in dollars. It’s asking, “Is the work we’ve done worth what we planned to have done by now?” The formula is SV = EV - PV. A positive number means you’re ahead of schedule; negative means you’re falling behind.
To see this in action, let’s use a practical example: You’re managing a marketing campaign. After one month, you planned to have completed $5,000 worth of work (PV). You actually completed $4,000 worth (EV) and spent $6,000 to do it (AC).
- Your Cost Variance (CV) is $4,000 - $6,000 = -$2,000 (over budget).
- Your Schedule Variance (SV) is $4,000 - $5,000 = -$1,000 (behind schedule).
Measuring Project Efficiency. While variances give you a dollar amount, performance indices give you a ratio, a measure of efficiency. They tell you how effectively you’re using your time and money. For both of these, 1.0 is the magic number. It means you are perfectly on target.
A performance index score acts like a report card grade. A 1.0 is a perfect score, above 1.0 is excellent, and below 1.0 means you have some work to do.
Cost Performance Index (CPI) This is probably the most critical metric in the whole EVM toolbox. It measures your cost efficiency, answering, “How much value are we getting for every single dollar we spend?”
- Formula: CPI = EV / AC
- Interpretation: A CPI of 0.85 means you’re only getting 85 cents of value for every dollar spent. Not good. But a CPI of 1.10 means you’re getting $1.10 of value for every dollar, a fantastic result.
Schedule Performance Index (SPI) This index measures how efficiently your team is using their time. It tells you if you’re progressing at the rate you originally planned.
- Formula: SPI = EV / PV
- Interpretation: An SPI of 0.90 means you’re only getting work done at 90% of the planned rate. On the flip side, an SPI of 1.05 means you’re actually working 5% faster than scheduled.
These simple formulas are what turn basic project tracking into powerful business intelligence. They’re essential for any team looking to tighten up their project management and accounting practices because they create a direct, undeniable link between your financial data and your team’s actual progress.
Applying EVM to a Real-World Agency Project
Theory and formulas are one thing, but let’s make Earned Value Management really sink in by running it through a scenario every agency has lived through. We’ll walk through a tangible, step-by-step example to see how the numbers tell a story, one that helps you make much smarter decisions.

Imagine your team just kicked off a major website redesign for a new client. It’s a big undertaking with a clear budget and timeline. Let’s set the scene before we get into the numbers.
The Project Scenario. Here are the high-level details for our friendly example:
- Project: Complete Website Redesign
- Total Budget (BAC): $40,000
- Total Timeline: 4 months
- Our Checkpoint: We’re exactly 2 months in (the halfway point).
To keep things simple, let’s say the work is planned to be spread evenly across the four months. This gives us a clean baseline to work from.
Establishing the Baseline (PV). At the two-month mark, we’re supposed to be exactly halfway through the project. That makes our Planned Value (PV) pretty straightforward to calculate.
- PV = $20,000 (which is 50% of the total $40,000 budget)
This is our yardstick. According to our original plan, we should have completed $20,000 worth of work by now. But as any project manager knows all too well, plans rarely survive first contact with reality.
Assessing the Reality (EV and AC). Time for an honest check-in. We review all the work done so far and find a bit of a mixed bag. The design team absolutely crushed it and finished all their mockups. However, the development team ran into some unexpected bugs, and we had to buy a premium plugin that wasn’t in the original budget.
After a careful review of what’s actually been delivered, we determine we’ve only completed 40% of the total project scope.
- Earned Value (EV) = $16,000 (40% of the total $40,000 budget)
Next up, we pull the financial reports. Between all the team hours logged and that unexpected plugin cost, our total spending to date is a little higher than we’d like.
- Actual Cost (AC) = $18,800
With these three key figures—PV, EV, and AC—we have everything we need to calculate our performance and see what’s really going on with this project.
Calculating the Metrics and Taking Action. Now for the fun part. Let’s plug our numbers into the formulas and see what story they tell.
Here’s a breakdown of how the calculations work for our website redesign scenario at the two-month checkpoint.
Sample Website Redesign EVM Calculation (at 2-Month Mark)
| Metric | Formula | Calculation | Result | Interpretation |
|---|---|---|---|---|
| Cost Variance (CV) | EV - AC | $16,000 - $18,800 | -$2,800 | We are $2,800 over budget for the work we’ve completed. |
| Schedule Variance (SV) | EV - PV | $16,000 - $20,000 | -$4,000 | We are $4,000 worth of work behind schedule. |
| Cost Perf. Index (CPI) | EV / AC | $16,000 / $18,800 | 0.85 | For every $1 we spend, we only get $0.85 of value. |
| Schedule Perf. Index (SPI) | EV / PV | $16,000 / $20,000 | 0.80 | We’re progressing at just 80% of our planned speed. |
These simple calculations paint a clear, undeniable picture. Our project is both over budget and behind schedule. This isn’t just a vague feeling anymore; it’s a quantifiable problem that demands an immediate response.
The data provides a clear, undeniable picture: our project is both over budget and behind schedule. This isn’t a vague feeling; it’s a quantifiable problem that demands immediate attention.
Armed with this information, a project manager can stop guessing and start acting. They might need to re-allocate resources to get the development tasks back on track, find ways to trim future costs, or have a transparent conversation with the client about adjusting the scope or timeline.
This is the real power of EVM. It transforms you from a reactive manager into a proactive leader, which is an absolute must-have for successful project management for creative agencies.
The Pros and Cons of Using EVM Today
Earned Value Management is an incredibly powerful framework, but let’s be honest, it’s not a magic bullet. To get real value out of it, especially in a modern agency or consulting firm, you need to go in with your eyes wide open.
Understanding both the huge upsides and the potential headaches will help you figure out exactly when and how to weave EVM into your projects.
The Real-World Benefits of EVM. When you get it right, EVM delivers tangible results that go way beyond simple budget tracking.
First off, it gives you a single, objective source of truth. It cuts right through the subjective “we’re about 80% done” progress reports and gut feelings, offering a clear, data-driven snapshot of where things really stand by tying scope, schedule, and cost together. That clarity is gold for talking to stakeholders and making smart internal decisions.
Another massive plus is its power as an early warning system. Metrics like CPI and SPI don’t just tell you where you are today; they help you see where you’re headed. Spotting a cost or schedule variance when it’s just a small blip gives you the chance to make corrections before a minor issue snowballs into a full-blown crisis.
Let’s break down the core advantages:
- Objective Status Reporting: It replaces vague updates with hard numbers. This makes conversations with clients and leadership far more productive and transparent. No more guesswork.
- Improved Forecasting: Using performance indexes like CPI and SPI, you can create much more realistic forecasts for your project’s final cost and completion date. These are based on actual performance, not just wishful thinking from the start of the project.
- Proactive Problem Solving: EVM forces you to confront issues head-on. A dipping CPI is an undeniable signal to dig into your costs, letting you fix the root cause instead of just patching over the symptoms.
The global adoption of EVM really speaks for itself. Roughly 70% of major projects exceeding $10 million worldwide now use it in some form. And the results are clear: companies using EVM report a 15-25% improvement in on-time delivery rates. That’s huge, and it’s largely thanks to the objective data and early warnings it provides. You can discover more insights about EVM adoption at hexagon.com.
Common Hurdles and How to Overcome Them. Of course, EVM isn’t without its challenges. One of the biggest hurdles is the upfront effort it takes to get started. Setting up a detailed Performance Measurement Baseline (PMB) requires time and meticulous planning. You need a rock-solid scope, a work breakdown structure, and a time-phased budget before you can even begin.
Another common concern, particularly for agencies, is how much EVM relies on a stable scope. The whole framework was born in industries where project plans are relatively fixed. In agile environments where change is the only constant, a rigid EVM application can feel clunky and bureaucratic.
The key is not to treat EVM as a rigid, all-or-nothing system. Instead, think of it as a flexible framework you can adapt to fit your project’s specific needs and complexity.
For instance, you don’t need to roll out the full suite of formulas for every small internal project. A simplified “EVM Lite” approach that just focuses on PV, EV, and AC can still offer massive value. For agile teams, you can adapt the principles by using things like story points to measure earned value and tying your budget to sprint costs. It’s all about blending that agile spirit with solid financial accountability.
The goal here is to gain insight, not to create a mountain of unnecessary paperwork. The EVM software market itself reflects this growing demand for flexibility: Verified Market Reports estimates the global EVM system market at USD 1.5 billion in 2024, projected to reach USD 3.2 billion by 2033 as more firms adopt cloud-based and AI-enhanced variants of the framework.
So, are you ready to bring the power of Earned Value Management to your projects? Good news: you don’t need a Ph.D. in mathematics or a suite of complex software to get going. EVM is just a more disciplined way of tracking your work. You can even start with simple spreadsheets and build from there.
This is a straightforward, actionable plan to help you get started without feeling overwhelmed.

Four Steps to Implement EVM. Putting EVM into practice really just comes down to four foundational steps. Each one builds on the last, giving you a complete, honest picture of your project’s health.
-
Define and Decompose Your Scope First things first, get crystal clear on your project’s scope. From there, break down all the work into smaller, measurable tasks or work packages. This Work Breakdown Structure (WBS) is the backbone of your entire EVM system.
-
Develop a Phased Budget With your tasks clearly defined, assign a budget to each one. The next move is to schedule these tasks across the project’s timeline. This process creates your Planned Value (PV) baseline, the benchmark you’ll measure everything against.
-
Track Progress Consistently You’ll need to pick a consistent method for tracking progress and calculating your Earned Value (EV). It could be as simple as the 0/100 rule (where a task gets 0% credit until it’s 100% done) or just a percentage complete estimate. The real key here is to be objective and consistent across the whole project.
-
Capture All Actual Costs Finally, you need a simple system to capture every single dollar spent. This has to include labor, materials, and any other direct expenses tied to the project. When you total this up, you have your Actual Cost (AC).
The core idea is to establish a clear plan, measure your actual progress against that plan, and compare it to your actual spending. This simple loop provides the powerful insights at the heart of what earned value management is.
Modern professional services automation (PSA) platforms can make this entire process much smoother. Tools designed for project-based work, like consultancies and agencies, often have built-in features for time entry, budget vs. actuals tracking, and integrated reporting. This strips away a lot of the manual data collection, letting you focus on analyzing the numbers and taking action. You can learn more about how PSA software simplifies operations in our detailed guide.
By following these steps, you can start weaving EVM principles into your workflow. The payoff is much clearer visibility and far greater control over your project outcomes.
As you start to get your head around Earned Value Management, a few questions always seem to come up. Let’s tackle them head-on, clear up any confusion, and help you see exactly how EVM can fit into your day-to-day.
Can EVM Work with Agile Projects?
Absolutely, though it does require a slight shift in thinking. Instead of locking in a rigid, long-term plan, you can adapt EVM to fit the sprint-by-sprint nature of Agile.
Many teams do this by using story points as a proxy for Earned Value (EV). If a two-week sprint has 50 story points planned and the team knocks out 40, they’ve “earned” the value of those 40 points. The sprint’s cost then becomes your Actual Cost (AC), giving you a clean performance check for each iteration.
How Is EVM Different from Just Tracking My Budget?
This is a fantastic question because it cuts right to the heart of what makes EVM so powerful. Simply tracking your budget tells you what you’ve spent. It gives you zero insight into what you’ve actually accomplished for that money.
Earned Value Management adds the critical dimensions of schedule and performance to your financial data. It connects your spending directly to your progress, answering the question: “Are we getting the value we paid for?”
Budget tracking might show you’re 50% through your funds, but EVM is what will tell you that you’ve only completed 25% of the work. That’s the difference between thinking you’re on track and knowing you have a problem to solve.
Is EVM Overkill for Small Projects?
It really doesn’t have to be. While applying the full suite of forecasting formulas might be too much for a small internal project, the core principles are incredibly scalable. This is often called “EVM Lite.”
You can get a huge amount of value by simply tracking the three main pillars: Planned Value (PV), Earned Value (EV), and Actual Cost (AC). Even without calculating all the performance indices, just comparing those three numbers gives you a powerful, at-a-glance health check on your project. This makes the concept of earned value management adaptable for projects of any size.
Ready to stop guessing and start knowing?
Drum gives you the tools to track time, monitor budgets against actuals, and generate the reports you need to keep your projects profitable and on track.
Start your free 14-day trial and discover a better way to run your studio.