Project Schedule Variance: How to Spot Delays Before They Derail Your Timeline
Ben Walker
Written for Drum

In This Article
Project Schedule Variance: A Practical Guide
Ever get that sinking feeling a project is slipping behind, but you can’t quite put your finger on why? We’ve all been there. Project Schedule Variance (SV) is the metric that turns that gut feeling into a hard number. It cuts through the noise and tells you the difference between the work you planned to have done and the work you’ve actually finished, all measured in cold, hard dollar value.
What Is Project Schedule Variance and Why It Matters
Let’s use a simple analogy. Think of your project plan as a road trip map. You planned to drive 200 miles by noon (your Planned Value). But when noon rolls around, you check the odometer and see you’ve only covered 150 miles (your Earned Value). That 50-mile gap is your schedule variance, a crystal-clear sign you’re running behind.
In professional services, SV translates this exact idea into financial terms. It shows you precisely how far off track you are in terms of the billable work you’ve delivered. For any consulting, engineering, or marketing firm where every hour is tied directly to revenue, mastering project schedule variance is non-negotiable. It’s one of the most honest measures of project health and has a huge impact on both profitability and client happiness.
The Real-World Impact of Delays. Falling behind isn’t just a minor headache; it snowballs into serious financial trouble. A 2020 analysis of global capital projects found the average delay was a staggering 20 months, with cost overruns of 20–30%. For service firms, the numbers are smaller but just as damaging. A recurring 5–8% negative schedule variance on billable work can easily chew up several percentage points of your annual profit margin. You can discover more insights about project scheduling on monday.com.
Schedule Variance isn’t just about being “late.” It’s about quantifying the value of the work that hasn’t been delivered on time, giving you a financial snapshot of your timeline’s health.
Ultimately, SV is your early warning system. It gives you the data you need to make smart adjustments before a small issue becomes a client-facing disaster. It helps you answer the tough questions with confidence:
- Are we genuinely on track to hit our deadline?
- Is our current pace sustainable, or is the team heading for burnout?
- Do we need to bring in more resources or adjust the scope to get back on schedule?
By keeping a close eye on this metric, you shift from reactive firefighting to proactive project leadership. That’s how you keep projects on time, on budget, and clients happy.
How to Calculate Schedule Variance the Right Way
Figuring out your project’s Schedule Variance (SV) is way less intimidating than it sounds. It all boils down to one simple formula: SV = EV - PV. Let’s ditch the jargon and break down what this actually means for your projects.
The whole thing hinges on two key ideas: Planned Value (PV) and Earned Value (EV). Get these, and you’ve got it made.
What Is Planned Value (PV)? Planned Value (PV) is simply the budgeted cost of the work you planned to have done by a certain point in time. Think of it as your project’s GPS destination.
If your project plan says you should be halfway through a $20,000 project today, your PV at this midpoint is $10,000. It’s the value you expected to have created by now, according to the schedule.
What Is Earned Value (EV)? Earned Value (EV), on the other hand, is the budgeted cost of the work you’ve actually completed. This number shows the real, tangible value you’ve generated so far, no matter what the calendar says.
So, if that same $20,000 project is only 40% complete at the midpoint, your EV is $8,000 ($20,000 x 40%). It’s the real-world value of the progress you’ve made.
Nailing down your EV depends entirely on accurate time and progress tracking. Understanding how to track time against specific project tasks isn’t just good practice; it’s fundamental to getting this number right.
The core of the calculation is simple: You’re comparing the value of the work you’ve actually done (EV) against the value of the work you planned to do (PV). The difference tells your project’s story.
Here’s a quick table to keep these terms straight. Think of it as a cheat sheet for the SV formula.
| Key Terms for Calculating Schedule Variance | |||
|---|---|---|---|
| Term | Abbreviation | What It Means | Simple Analogy |
| Planned Value | PV | The budgeted cost of work scheduled to be done. | Where your project’s GPS said you would be. |
| Earned Value | EV | The budgeted cost of work actually completed. | Where your project actually is on the map. |
| Schedule Variance | SV | The difference between EV and PV. | The distance between where you are and where you planned to be. |
With these definitions in your back pocket, you’re ready to see how the formula works in the real world.
A Practical Website Project Example. Let’s put this into practice. Imagine you’re running a website development project for a client. The total budget is $50,000, and the project is set to last four months.
At the end of Month 2, you sit down to check on progress. According to your original project plan, you should be exactly 50% complete.
- Calculate Planned Value (PV): $50,000 (Total Budget) x 50% (Planned Completion) = $25,000
But after reviewing the team’s work (wireframes are done, designs are approved, but backend development is lagging) you realize you’re only 40% finished.
- Calculate Earned Value (EV): $50,000 (Total Budget) x 40% (Actual Completion) = $20,000
Now for the easy part. Plug those numbers into the formula:
- SV = EV - PV
- SV = $20,000 - $25,000
- SV = -$5,000
This result gives you a crystal-clear, financial measure of your schedule. You are currently $5,000 worth of work behind where you planned to be. That single number is your cue to dig into the ‘why’ and take action before that gap gets any wider.
Interpreting Your Schedule Variance Results
So, you’ve crunched the numbers and now you’re staring at a single, powerful figure. What is it actually telling you? This is the moment your schedule variance (SV) number transforms from data on a spreadsheet into a clear story about your project’s health.
Think of it as your project’s report card. It gives you a grade, and your job as the project manager is to understand precisely what that grade means and what to do next. The interpretation is refreshingly straightforward. There are really only three possible outcomes, and each one sends a distinct signal.

What the Numbers Mean. Your SV result tells you if you’re ahead, behind, or right on track, all framed in financial terms. Each scenario calls for a completely different kind of conversation and action.
-
Positive SV (e.g., +$5,000): This is fantastic news! It means you are ahead of schedule. Your team has delivered more value than was planned for at this point in time. For example, your engineering team finished a complex feature a week early. This might give you an opportunity to reallocate those engineers to another struggling project or even deliver early, delighting your client.
-
Negative SV (e.g., -$5,000): This is your early warning signal. A negative value is a clear indicator that you’re falling behind schedule. You’ve completed less work than you planned to, and that -$5,000 represents the dollar value of the work that is currently late. Perhaps a key designer was out sick, delaying mockups. Treat this as a clear call to investigate the root cause immediately.
-
Zero SV ($0): You are perfectly on track. The value of the work your team has completed exactly matches the value of the work you had planned. While hitting zero exactly is rare in the real world, it’s the ideal state you’re always aiming for.
The real power of Schedule Variance isn’t just in knowing you’re off track; it’s in knowing by how much. A -$500 variance is a gentle nudge, but a -$50,000 variance is a five-alarm fire.
From Data to Decisive Action. Catching a negative variance early is absolutely critical. A global study by the Project Management Institute found that once a project’s SV dropped below –15% at its midpoint, the probability of finishing on time plummeted to less than 20%. This stat alone highlights why mature schedule control practices are so vital for success. If you’re interested, you can read more about the research into project management maturity and see how top-performing firms stay ahead of the curve.
Let’s go back to our website project example with an SV of -$5,000. Instead of panicking, this number should prompt you to ask sharp, targeted questions:
- Is the backend development team understaffed for the workload?
- Did the client delay providing the critical feedback they promised?
- Was our original time estimate for this phase just plain unrealistic?
Armed with this data, you can have a proactive, evidence-based conversation with your client and your team. You can discuss adjusting timelines, re-prioritizing tasks, or modifying the scope before the delay snowballs into a full-blown crisis. This is how SV transforms from a simple metric into a powerful tool for communication and course correction.
Common Causes of Negative Schedule Variance
Seeing a negative schedule variance pop up on your project dashboard can feel like a gut punch, but let’s be honest, it’s rarely a total surprise. A negative SV isn’t the actual disease; it’s the symptom. It’s a loud, clear signal that something in your original plan has gone sideways, and it’s your job to play detective and figure out what’s really going on.
Most of the time, the culprit is one of a few usual suspects that love to plague professional services projects. Once you learn to spot these common issues, you can shift from just reacting to problems to actively getting ahead of them.
Unrealistic Initial Estimates. This one is probably the most common driver of negative schedule variance. It’s when a project is essentially set up for failure from the get-go with a timeline or budget that was wildly optimistic. This can happen for a bunch of reasons: pressure to win a competitive bid, not having enough historical data to lean on, or just plain underestimating how complex the work really is.
When the plan doesn’t match reality, the schedule starts slipping almost from day one. Your best defense here is a good offense: build your estimates from data by looking at similar past projects and always, always build in a buffer for the unexpected. According to Wrike’s project management guide, consistent schedule variance tracking is the single most reliable way to catch these estimation problems early, before they compound into full-blown budget crises.
The Slow Burn of Scope Creep. Scope creep is the silent killer of projects. It usually starts with a “quick” or “small” client request that wasn’t in the original statement of work. Then comes another one. And another. On their own, they seem harmless, but they pile up, eating away at unplanned hours and pushing your timeline further and further into the red.
The answer isn’t to just say “no” to everything, but to have a rock-solid process for managing change.
- Implement a Change Order Process: Document every single new request, estimate its impact on both the schedule and the budget, and get a clear sign-off from the client before you start the work.
- Set Clear Boundaries: Don’t be afraid to revisit the original scope with the client to gently remind everyone what was agreed upon at the start.
This creates a fair, transparent system that protects your team, your timeline, and your firm’s profitability.
A negative Schedule Variance often starts with a single “yes.” Learning to manage client requests with a structured change process is one of the most effective ways to protect your project’s health and your firm’s profitability.
Resource Bottlenecks and Allocation Issues. Even with a flawless plan, a project can fall behind if you don’t have the right people available at the right time. A resource bottleneck is what happens when a key team member is completely overloaded, or when a specialist you need for a critical task is double-booked on another project. The work just piles up, creating a logjam that holds up every task that comes after it.
This is exactly where proactive resource management proves its worth. Being able to see your team’s capacity and future project demands helps you spot these potential conflicts weeks before they become a crisis. Good resource planning and management ensures your team’s workload is balanced and that the right skills are on the right tasks from the beginning.
Finally, don’t forget about things outside your direct control. A project can be perfectly planned and resourced, but if you’re stuck waiting on delayed client feedback, content, or approvals, your schedule is going to suffer. Building client check-ins and approval milestones directly into the project plan makes these dependencies visible and helps keep everyone, including the client, accountable.
To help you get ahead of these issues, we’ve put together a quick diagnostic table. Think of it as a playbook for turning things around when your schedule starts to slip.
Diagnosing and Treating Negative Schedule Variance
| Common Cause | Why It Happens | Corrective Action to Take |
|---|---|---|
| Unrealistic Estimates | The initial timeline or budget was too optimistic due to sales pressure, lack of data, or underestimating complexity. | Review and re-baseline the project plan with the client. Use data from this project to improve future estimates. |
| Scope Creep | Small, un-documented changes and “quick requests” from the client add up, consuming unplanned time and effort. | Implement a formal change order process. Document all new requests, assess their impact, and get client approval before proceeding. |
| Resource Bottlenecks | A key team member is overloaded, or a required specialist is unavailable, causing delays for dependent tasks. | Re-evaluate resource allocations. Look for opportunities to offload tasks, bring in additional help, or adjust priorities across projects. |
| Skill Gaps | The team lacks the specific expertise needed to complete a task efficiently, leading to rework or slower-than-planned progress. | Provide targeted training, bring in a short-term specialist, or reassign the task to a more experienced team member. |
| Delayed Dependencies | The project is stalled waiting for input, feedback, or materials from the client or a third party. | Increase communication frequency. Clearly document the impact of the delay and work with the client to get what you need. |
By keeping an eye out for these common culprits and having a clear plan of action, you can catch negative schedule variance early and steer your project back toward a successful, profitable outcome.
How PSA Software Automates Schedule Variance Tracking
Let’s be honest, trying to calculate project schedule variance manually in a spreadsheet is a nightmare. It’s not just tedious; it’s a perfect recipe for expensive mistakes. You’re constantly jumping between timesheets, the project plan, and various budget documents, trying to make sense of data that’s probably already out of date. This is exactly where a modern Professional Services Automation (PSA) platform comes in to act as your co-pilot.
A solid PSA tool connects all the critical parts of your projects—the plan, your team’s actual time entries, and the budget—into a single source of truth. By bringing everything together, the system does the heavy lifting for you, automatically calculating Earned Value (EV) and Planned Value (PV) in real time. This flips your project reporting from a backward-looking chore into a live, always-on health dashboard. You can learn more about what is PSA software in our detailed guide to see how it pulls all these functions together.
From Reactive Firefighting to Proactive Leadership. Instead of finding out about a schedule slip weeks after it started, a PSA tool gives you instant clarity. Imagine seeing a project’s health status flip from green to yellow the second its schedule variance dips into the red. That immediate feedback lets you step in right away, long before a small delay snowballs into a major crisis.
This kind of dashboard gives you a clear, at-a-glance view of all your key project metrics, including schedule variance.
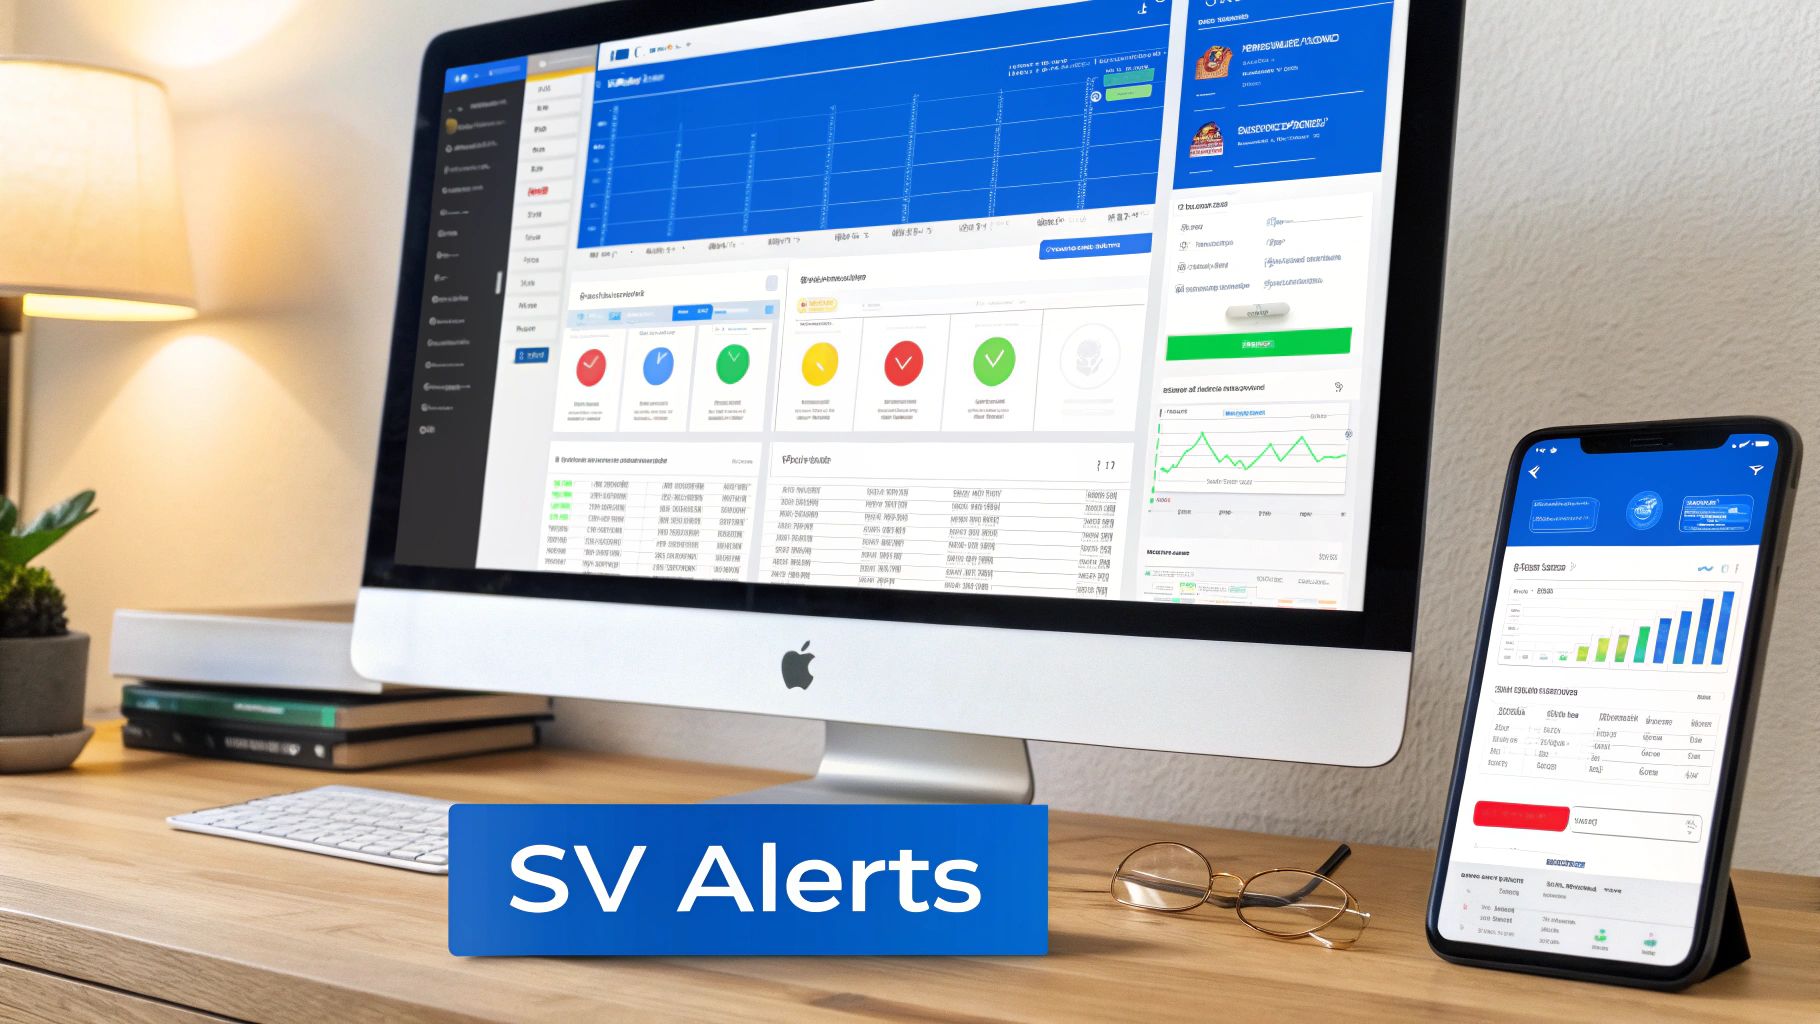
You can instantly spot which projects are humming along and which ones are in trouble, so you know exactly where to focus your attention.
The real advantage, though, is setting up automated alerts so you can manage by exception. You can configure your system to ping you the moment a project’s SV crosses a threshold you’ve defined. This proactive approach completely changes how you manage your portfolio.
Instead of constantly hunting for problems, you let the problems find you. This frees you up to focus on the big picture (strategic decisions, client relationships, and team leadership) instead of getting lost in the weeds of manual data crunching.
Setting Up Smart Alerts for Schedule Variance. A great PSA system lets you build custom workflows and alerts that fit your firm’s specific needs. This means you can create rules that act as a safety net, automatically flagging potential issues before they get out of hand.
Here are a few practical examples of alerts you could set up:
- Negative SV Threshold: Create an alert that sends an email to the project manager and an operations lead if any project’s SV drops below -10%.
- Approaching Deadline Warning: Trigger a notification when a project is 80% through its timeline but has an SV of less than -5%, flagging a high risk of missing the deadline.
- Positive SV Recognition: Set up a weekly report that highlights projects with a positive SV of +15% or more. This helps identify high-performing teams and gives you a chance to share their best practices across the company.
By automating how you monitor schedule variance, you shift from being a reactive problem-solver to a proactive leader. This change doesn’t just save you countless hours of admin work; it drives better project outcomes, protects your profit margins, and ultimately leads to happier clients and more successful projects.
Even when you’ve got the basics down, applying schedule variance in the real world throws up a few curveballs. Let’s tackle the most common questions project managers ask, so you can start using this metric with confidence.
What Is an Acceptable Schedule Variance?
This is the million-dollar question, and the honest-to-goodness answer is: it depends. There’s no single magic number that fits every project, let alone every client. That said, a widely accepted rule of thumb in professional services is that a schedule variance within ±10% is generally manageable.
A variance in this range usually just reflects the normal ebb and flow of a project. It’s often something you can correct without tearing up the entire project plan.
Once your variance drops below -10%, that’s a red flag. It’s a strong signal to stop, take a breath, and conduct a formal review. This is the point where a casual “we’re a bit behind” chat needs to evolve into a structured discussion about getting things back on track.
The best move you can make is to define these thresholds with your client right at the start. Setting expectations early on prevents nasty surprises and gets everyone on the same page about what “on track” actually means.
Can a Project Be Ahead of Schedule but Over Budget?
Absolutely. This happens all the time, and it’s a classic scenario that perfectly illustrates why you can’t look at schedule variance in a vacuum. SV only tells you how you’re tracking against the timeline; it says nothing about what it cost to get there.
This is where its partner metric, Cost Variance (CV), comes in. CV is all about your performance against the budget.
Here’s a real-world example: Imagine your team is falling behind on a critical design phase. To claw back the time, you authorize weekend overtime and bring in a freelance designer for a week. The plan works—you not only catch up but even get a little ahead of the original schedule.
- Your Schedule Variance (SV) would be positive, showing you’re ahead.
- But your Cost Variance (CV) would be negative, because the overtime and freelancer fees blew the budget for that phase clean out of the water.
This is exactly why you have to monitor SV and CV together. They give you a complete, balanced picture of project health, telling you not just if you’re on time, but at what cost.
How Often Should I Calculate Schedule Variance?
The right cadence really depends on the length and complexity of your project. You’re looking for that sweet spot: a rhythm that lets you catch problems before they snowball, without bogging you down in admin.
- For most projects lasting a few months, a weekly review is perfect. This is frequent enough to spot deviations early and make timely adjustments before they become major issues.
- For longer, more complex projects (6+ months), a bi-weekly or even monthly high-level check might be enough for a steering committee, but the core project team should still be looking at the numbers every week.
One of the huge advantages of using a modern PSA tool is that this calculation is automated and happens in real-time. The data is always sitting right there on your dashboard, so you can check in whenever you need to, without the headache of manually crunching numbers in a spreadsheet.
What Is the Difference Between SV and SPI?
This is a common point of confusion, but the distinction is actually pretty useful. Both SV and the Schedule Performance Index (SPI) measure your progress against the schedule, but they tell the story in different ways.
Schedule Variance (SV) gives you an absolute number. It’s a concrete dollar figure that tells you the financial value of the work that is either behind or ahead of schedule.
- For example: “We are $10,000 worth of work behind schedule.” It’s a direct, tangible impact.
Schedule Performance Index (SPI), which is calculated as EV / PV, gives you an efficiency ratio. It tells you how effectively your team is turning planned effort into completed work.
- For example: An SPI of 0.90 means you are only getting 90 cents of value for every dollar of work you had planned to get done by this point.
Here’s a simple way to think about it: SV is perfect for understanding the specific financial hit on a single project. SPI is fantastic for comparing the relative efficiency across multiple projects, even if they’re of different sizes and values.
Ready to stop chasing down data in spreadsheets and start getting real-time insights into your project's health?
Drum unifies your project planning, time tracking, and budgeting into a single, intuitive platform that automates schedule variance tracking for you. See how you can move from reactive problem-solving to proactive project leadership.
Start your free 14-day trial and discover a better way to run your studio.