Revenue Per Employee: How to Calculate It, What's Normal, and How to Improve It
Ben Walker
Written for Drum

In This Article
Revenue Per Employee: What It Means for Firms
Revenue per employee (RPE) is simply your total annual revenue divided by the number of people on your payroll. According to Deltek’s 2025 Professional Services Benchmarks, firms experienced a 4.6% decline in revenue growth year-on-year in 2024, making RPE tracking more critical than ever. It tells you, in dollars per person, how effectively your team turns time into income. Think of RPE as your efficiency dashboard. When it climbs, you’re getting more mileage out of each staff member; when it stalls, it’s time to rethink staffing, pricing, or project mix.
Measuring Workforce Efficiency With RPE

Imagine your firm as a high-performance engine. The fuel is your revenue, and the distance covered is the number of employees on board. The higher your RPE, the smoother and more powerful that engine runs. For example, a boutique design studio boosted its RPE by 12% simply by tightening utilization targets and negotiating higher retainer fees.
Below is the roadmap for this guide:
- Step-By-Step Formulas for calculating RPE precisely
- Industry Benchmarks tailored to consulting, agencies, architecture, and engineering
- Case Studies revealing common pitfalls and success stories
- Practical Tactics you can implement to boost your RPE in 30 days
- Drum PSA Features: time tracking, utilization, project profitability, Xero/QuickBooks integrations, capacity planning, and reporting
After this introduction, we’ll unpack core concepts, walk through detailed examples (including part-time and churned staff), and compare benchmarks across professional services. Finally, you’ll see exactly how Drum’s PSA tools tie it all together in real time.
Why RPE Matters.
Spotting inefficiencies early helps you fine-tune headcount and pricing without waiting for quarterly results. A small shift in utilization or rate cards can ripple through your bottom line almost instantly. For instance, one engineering consultancy lifted its RPE by 8% within weeks of introducing a tiered rate card. This section lays the groundwork so you can diagnose issues quickly and apply targeted fixes that stick.
By the end, you’ll understand how RPE uncovers hidden capacity, drives sustainable growth, and integrates with Drum’s time tracking, capacity planning, and integrated Xero or QuickBooks links.
Section Preview.
- A clear engine-to-workforce analogy
- Step-by-step FTE conversion and handling part-time staff
- Common calculation pitfalls to avoid
- Using Drum’s PSA reporting for real-time visibility
This guide unlocks smarter staffing decisions and pricing strategies.
Imagine hitting the open road. Your firm is the car, and each team member represents a mile on the odometer. Revenue per employee shows you how many dollars you cover for every person riding shotgun.
This metric digs deeper than utilization or profit per head, revealing the combined effect of topline revenue and staffing efficiency.
- Utilization Rate shows the share of billable hours each person clocks.
- Profit Per Employee divides net profit by total staff.
- Revenue Per Employee (RPE) blends both revenue and headcount into one clear figure.
Each metric offers its own lens, but RPE is your true odometer for overall efficiency.
Fuel Economy Analogy.
Think of a boutique design studio boasting $200,000 in RPE. They charge premium rates and keep a tight-knit team. Contrast that with a large engineering firm at $100,000 RPE, with more people but lower revenue per head. A small marketing firm switched to weekly capacity reviews and saw its RPE climb 10% within a month.
| Firm Type | RPE | Key Factor |
|---|---|---|
| Boutique Design Studio | $200,000 | Lean Staffing |
| Large Engineering Firm | $100,000 | High Headcount |
Comparing Utilization And Profit.
Utilization rate zeroes in on the percentage of chargeable hours, while profit per employee tracks net income per head at year-end. Neither captures the full scale of your revenue engine quite like RPE.
You can enjoy high utilization yet still see low RPE if your rates lag.
- A niche consultancy raises rates by 10% and watches RPE climb 10% the next quarter.
- Adding two specialists without growing revenue drags RPE down immediately.
- Boosting billable hours from 60% to 75% lifts RPE, even with the same team size.
Shifts In Pricing And Mix.
A 15% bump in rates can move RPE from $200k to $230k per employee almost overnight. But hiring more juniors without extra revenue will dilute that number just as quickly.
Key Insight
Small staffing or rate changes show up instantly on your RPE dashboard. No guesswork needed.
That clarity helps you diagnose whether underperformance is a pricing issue or a utilization gap.
Accounting For Part Time And Churn.
Not everyone clocks the full-time schedule, so convert hours into full-time equivalents (FTE) before running your RPE calculation.
- Tally hours from part-timers and contractors.
- Divide by standard full-time annual hours (e.g., 2,080).
- Add that FTE total to your full-time headcount.
Adjust for churn by excluding people who left mid-year or prorating their hours. This keeps your RPE accurate and avoids spikes when headcount shifts.
- Example Firm
- Revenue: $1,000,000
- Staff: 8 full-timers + 4 contractors at 20 hrs/week
- FTE Calculation: 8 + (4 × 0.5) = 10
- Resulting RPE: $100,000
Armed with these basics, you can now calculate and interpret your RPE with confidence.
Key Takeaways On RPE.
- RPE combines revenue and headcount into a single efficiency metric.
- Tweak rates, utilization, or staffing mix, and you’ll see RPE move immediately.
- Accurate FTE conversion and churn accounting keep your metric honest.
Up next, we’ll walk through step-by-step calculation methods and real-world examples to master revenue per employee.
Calculation Methods And Examples
Crunching your Revenue Per Employee (RPE) starts with a straightforward formula, but the nuance lies in how you count your people. Think of full-time equivalents (FTEs) as the fuel gauge: you need an accurate measure of capacity before you calculate mileage.
To nail your RPE:
- Step 1 Gather total annual revenue, including both billable and non-billable streams.
- Step 2 Tally all hours from full-time, part-time and contractors, then divide by 2,080 (the standard annual hours per FTE).
- Step 3 Prorate or exclude employees who joined or left mid-year to avoid inflating your headcount.
- Step 4 Divide your total revenue by the cleaned-up FTE figure to reveal your RPE.
Keep a close eye on contractor hours so you don’t double-count, and always reconcile with payroll data for rock-solid accuracy.
The infographic below shows how RPE flows into utilization and profit per employee through a simple process chart.
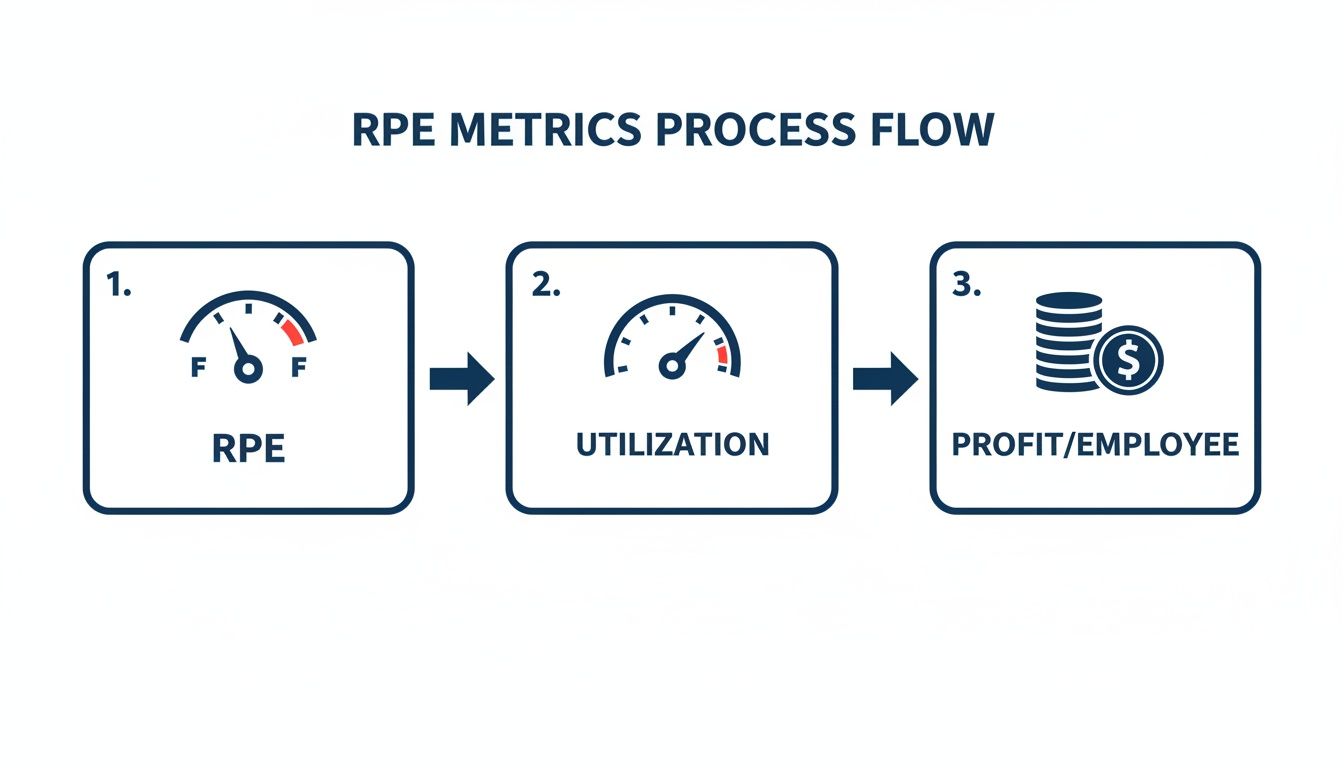
From this view, improving utilization directly lifts your RPE, which in turn drives up profit margins per head.
Examples For Different Staffing Scenarios.
Here’s a quick comparison of how staffing mix shifts the RPE dial:
| Scenario | Revenue | Headcount (FTE) | Revenue Per Employee |
|---|---|---|---|
| Full-Time Team | $1,000,000 | 10 | $100,000 |
| Mixed Part-Time Workforce | $1,000,000 | 8.5 | $117,647 |
| Post-Attrition Group | $1,000,000 | 9.5 | $105,263 |
Adding part-timers at half FTE boosts the per-person average, while unaccounted churn can create a misleading spike in RPE.
Step By Step Calculation.
Example A: A mid-sized consulting practice brings in $2,400,000 annually. They run 15 full-time consultants and 4 part-time analysts (20 hours/week each), which equals 15 + (4 × 0.5) = 17 FTE. Divide $2,400,000 by 17 and you land on $141,176 RPE.
Example B: An asset-light services firm posts $800,000 in revenue with 6 full-time experts and zero churn. Their calculation is simply $800,000 ÷ 6 = $133,333 RPE.
These illustrations show how revenue scale and headcount structure combine to shape your RPE reading.
Common Calculation Pitfalls.
A few missteps can throw your RPE off course:
- Double-counting hours when consultants log time across multiple tools
- Ignoring contractors paid by project rather than by the hour
- Failing to prorate employees who start or leave partway through the year
Dodge these traps, and your RPE will be a genuine performance yardstick.
How To Plug Your Own Numbers.
Ready to run your own analysis? Build this into your spreadsheet or financial system and then cross-refer with our guide on calculating overhead rate to see how overhead costs feed into your RPE.
Key Takeaway: Precise FTE conversion and proper adjustment for staff churn are just as crucial as revenue figures in calculating a trustworthy RPE.
With these methods in hand, you can track workforce efficiency and uncover where to push your revenue per employee higher.
Using Drum To Simplify Calculations.
Drum’s PSA platform turns manual RPE crunching into a few clicks:
- Time Tracking: Capture every hour, billable or not.
- Capacity Planning: Translate headcount into live FTE figures.
- Project Profitability: Tie revenue back to actual effort.
- Accounting Integrations: Sync directly with Xero or QuickBooks.
- Real-Time Dashboards: Watch RPE adjust instantly as staffing or rates change.
Drum can halve your calculation time, freeing you to focus on strategy. Export your revenue and time data, set up an RPE report, and see the metric update daily, arming you with a reliable KPI for reviews and growth planning.
Next, benchmark your results against industry standards to spot fresh opportunities.
Industry Benchmarks For Professional Firms
Industry benchmarks offer a reality check on your revenue per employee (RPE). In professional services, RPE swings dramatically based on how you price work, the projects you tackle, and the way you staff teams.
Consulting outfits typically sit at the top end of the spectrum. Data from HRBench’s 2025 industry analysis confirms that management consulting firms regularly land in the $200K-$400K range, while marketing agencies tend to cluster between $150K and $250K. They command premium hourly rates and run leaner teams. Creative agencies and architecture firms usually fall in the middle, while engineering groups often land between the two.
- Consulting Practices: $180k–$250k per employee
- Creative Agencies: $100k–$150k per employee
- Architecture Firms: $120k–$180k per employee
- Engineering Teams: $140k–$200k per employee
Spotting where you land within these bands can guide a closer look at pricing, utilization, or staffing strategies.
Even among the world’s top 20 revenue giants, you’ll see massive RPE gaps. Energy leaders, for example, outpace most sectors. Saudi Aramco posts an eye-watering $2.9 million RPE, far above its sector average of $2,932,287, thanks to over 70,000 employees and more than $500 billion in annual revenue from high-margin oil sales.
For a closer look at the biggest corporate RPE disparities, check out this VoronoiApp analysis of the world’s top 20 companies.
RPE Benchmarks By Industry.
Below is a quick snapshot of typical RPE levels across four core professional-services sectors:
| Industry | Average RPE |
|---|---|
| Consulting Practices | $180,000 |
| Creative Agencies | $125,000 |
| Architecture Firms | $150,000 |
| Engineering Teams | $170,000 |
Use this table to see whether you’re running above, below, or right on par with peers.
Factors Driving Sector Variation.
Several forces shape these RPE ranges:
- Pricing Models: From classic time-and-materials to fixed-fee or value-based billing.
- Project Complexity: High-touch engagements often require more senior (and costly) talent.
- Service Mix: A heavier focus on high-margin consulting vs. support or delivery roles.
Digging into these drivers helps you pinpoint where to push for gains, be it rate increases, tighter utilization targets, or a shift in service offerings.
Benchmark Insight
Falling more than 15% below your sector’s average is a clear sign to audit your pricing, utilization rates, or staffing mix.
With Drum’s live dashboards, you can instantly map your RPE against these benchmarks. Watch how small tweaks (like raising day rates or reallocating team hours) move the needle in real time.
Using Drum For Benchmarking.
Drum brings your revenue and time data into one unified platform. Here’s how you can harness it:
- Import your actual RPE and compare it to benchmark thresholds in real time.
- Set up alerts that trigger whenever your RPE dips below your chosen industry range.
- Tailor reports by segment: consulting, creative, architecture, or engineering.
Beyond benchmarking, Drum’s capacity planning gives you a clear view of who’s working on what and where hidden slack might be hiding.
Real-world wins:
- A midsize design studio lifted its RPE by 15% in a quarter after realigning rates with agency benchmarks.
- An engineering consultancy spotted a 10% shortfall in Q2 and rebalanced workloads to hit parity.
- Creative teams boosted their RPE by leaning into retainer clients, smoothing out revenue swings.
Key steps to keep momentum:
- Review RPE monthly to catch downward trends early.
- Benchmark across multiple sectors if you offer hybrid services.
- Adjust your service mix to focus on higher-RPE activities.
Start small, iterate quickly, and use Drum’s tools to turn raw numbers into strategic action. With clear benchmarks and real-time insights, you’ll steadily elevate your revenue per employee and sharpen your competitive edge.
Drivers And Common Pitfalls
Climbing the RPE ladder comes from smart choices, not blind luck. When you track RPE over time, you’ll spot how small process tweaks translate into real bottom-line gains.
Automation slashes manual handoffs and speeds up deliverables. A Scoro analysis of RPE drivers found that firms consistently tracking utilization and automating administrative tasks outperform peers by significant margins. It also builds consistency and reliability into your project timelines.
Strong pricing approaches dictate how much revenue each person on your team contributes. Shifting from pure time-and-materials to tiered rate cards or value-based models can push RPE into a new gear. A flexible rate card lets you reward expertise while managing client expectations.
Here are the three core levers that power RPE growth:
Key Efficiency Drivers.
- Automation: Cuts out repetitive tasks, shrinks non-billable windows and keeps work flowing.
- Pricing Strategy: Matches rates to client value and market demand, boosting per-employee returns.
- Staffing Mix: Blends senior leadership with junior support to maximize throughput without overspending.
Impact In Practice.
Consider a niche, asset-light business that’s reshaped efficiency on a global scale. Their secret? Focusing every step on margin-rich activities and lightening physical asset baggage.
Rajesh Exports, an Indian mining and jewelry outfit, leads the world in RPE. With 111 employees producing $34.09 billion in annual revenue, they hit an average of $307.12 million per person. You can explore the full breakdown in this analysis.
A niche, asset-light business model can deliver exceptional revenue per employee by focusing on high-margin processes.
How Drivers Interconnect.
These elements rarely work in isolation; they feed off each other in practical ways. Combining the right levers accelerates improvements across the board.
- Lower manual workloads drive down unit costs.
- Premium rates on automated offerings raise revenue per head.
- A smart staffing mix ensures the right skills are in place.
Balancing senior and junior talent shapes both utilization and your ability to automate without sacrificing quality.
Common Pitfalls To Avoid.
It’s easy to let headcount swell during slow periods, only to watch RPE dip without a revenue bump. That false signal can hide deeper performance issues.
If you skip precise utilization tracking, non-billable hours quietly erode your efficiency. Small leaks become productivity holes before you spot them.
- Treat part-time roles like full-time equivalents and distort your FTE math.
- Apply one-size-fits-all rates to a diverse service mix.
- Overlook automation for repeatable tasks.
Check out our guide on Drum’s time tracking features to make sure you’re capturing every hour and keeping your RPE honest.
By mastering these drivers and dodging common traps, you’ll decode your RPE data with clarity and put strategic adjustments into action that last.
Next Steps To Improve RPE.
Pinpoint your lowest RPE service lines and revisit your pricing tiers.
- Run a swift utilization audit.
- Pilot a simple automation tool for repetitive reports.
Then reassess your staffing mix based on those insights. These moves lay the groundwork for steady, measurable growth in your revenue per employee.

These moves can start nudging your revenue per employee upward in a matter of weeks. One boutique agency combined value-based bundles with automation reminders and saw an 18% RPE boost in just four weeks.
Refine Pricing Structures.
Packaging services into clear bundles often outperforms a traditional rate card. Clients love knowing exactly what they get, and at what price.
- Bundle core offerings such as strategy, design and implementation into a single package for higher perceived value.
- Pilot these bundles on low-risk assignments, gathering feedback from three to five clients.
- Expand the most successful combinations across your client base to lift margins.
Optimize Capacity Planning.
Idle bench time is money down the drain. Accurate headcount forecasting uncovers these hidden costs.
Drum’s capacity planning lets you align resource demand with available hours. This way, you catch overallocations before they dent your RPE.
- List upcoming project start dates and estimate hours by role.
- Cross-check those estimates against Drum’s real-time capacity data.
- Adjust hiring or contractor plans two to four weeks ahead.
- Hold a quick, weekly review to refine your forecast as new information comes in.
Use Automation And Tools.
Automating routine tasks can free up as much as 20% of your team’s time for billable work.
Drum automations can handle things like invoice reminders in the background. Less manual overhead means more focus on high-value projects.
| Tactic | Expected Impact |
|---|---|
| Value-based pricing trials | +15% in average fee |
| Automation of reminders | +20% in billable hours |
You’ll see these gains reflected in your Drum dashboard the moment you activate them.
“Winning small battles every day wins the war.”
Tie Financial Performance Analytics.
Real-time reporting makes RPE a living number, not a distant KPI. With Drum’s financial performance tools, filter by service line, client or project phase to spot trends fast.
When you spot a dip, tweak pricing or staffing immediately. Read our guide on financial performance analytics for a step-by-step walkthrough.
- Set alerts for when RPE falls below your target.
- Schedule monthly trend reviews with your leadership team.
- Share live dashboards in team meetings so everyone can see how their work impacts results.
Your next move? Choose one tactic, assign an owner and set a 30-day goal. Track progress daily and adjust weekly. Small, steady wins add up over time.
Monitor And Iterate Tactics.
No plan is set in stone. Define clear measures for each tactic and refine based on client feedback and financial results.
If a bundle isn’t resonating, tweak the price or scope. Test for two weeks and compare the shift in RPE before a full rollout.
Log your wins and share them at team huddles. Celebrating micro-successes keeps everyone motivated and cements best practices.
Pair RPE targets with individual metrics like utilization and profit per head. Then, link achievements to recognition programs to highlight top performers.
- Use training to address below-average RPE areas.
- Rotate team roles to spread knowledge and avoid bottlenecks.
- Align personal goals with team objectives for consistent improvements.
Work in 30-day sprints. Each sprint should conclude with a short RPE report. A focused two-hour review can reveal trends that casual checks might miss.
By bringing these elements together, you create a self-reinforcing circle of growth. Start small, adapt fast and watch your revenue per employee climb, all with Drum’s dashboards and automations keeping the pace high.
FAQ
Revenue per Employee (RPE) is simply your annual revenue divided by your full-time equivalent (FTE) headcount. It shines a spotlight on team efficiency and uncovers hidden profit leaks. Checking this metric regularly helps you catch shifts in pricing, utilization, or staffing before they become costly.
Getting RPE right starts with an accurate FTE count. As CompanySights explains, comparing your RPE against direct peers in the same sector and service type is far more meaningful than cross-industry averages. A raw headcount won’t cut it if you have part-time staff or contractors. You need to convert their hours into FTEs, prorate anyone who joins or leaves mid-year, and reconcile outside contractors against payroll.
Handling Part Time And Contractors.
- Convert part-time hours into FTE by dividing total hours by the standard 2,080.
- Include contractor hours only when they’re tracked in your system, and always match those against payroll records.
- Prorate headcount for team members who join or exit mid-year to prevent artificial spikes.
Typical RPE benchmarks shift depending on your services niche.
- Consulting firms: $180,000–$250,000 per employee
- Creative agencies: $100,000–$150,000 per employee
- Architecture & engineering: $120,000–$200,000 per employee
Insight If your RPE is more than 15% below industry peers, it’s time to dig into pricing and utilization.
How Automation And PSA Tools Boost RPE.
Automation can cut non-billable tasks by up to 20%, freeing your team to focus on billable work. Meanwhile, a PSA platform like Drum captures every hour, ties project profitability back to effort, and syncs revenue data with Xero or QuickBooks in real time.
Key benefits include:
- Live Time Tracking: Accurate billing and utilization numbers on the spot
- Project Profitability: Link costs and rates to see which projects truly pay off
- Capacity Planning: Balance workload so no one is over- or under-utilized
- Financial Reporting: Up-to-the-minute revenue figures in your dashboard
Ready to track RPE in real time and grow your bottom line?
Start your free 14-day trial and see your efficiency jump. Explore utilization alerts, capacity planning, and in-depth financial reports to keep your firm on a healthy growth path.