How to Calculate Overhead Rate: Formula, Examples, and What It Means for Your Pricing
Ben Walker
Written for Drum

In This Article
- How to Calculate Overhead Rate: A Simple Guide
- Understanding Your Overhead Rate and Why It Matters
- The Core Formulas for Calculating Overhead Rate
- Choosing the Right Allocation Base for Your Firm
- Calculating Overhead Rates with Real-World Examples
- Common Pitfalls When Calculating Overhead and How to Avoid Them
How to Calculate Overhead Rate: A Simple Guide
Figuring out your overhead rate is a key step to understanding your business’s financial health, and thankfully, it’s pretty straightforward. You just take your total indirect costs and divide them by a specific business metric, like your direct labor costs. The formula itself is simple, but the result is powerful—it gives you a clear percentage showing exactly how much it costs to keep the lights on for every dollar you spend on revenue-generating work.
Understanding Your Overhead Rate and Why It Matters

Just looking at revenue is like trying to gauge the health of an athlete by only watching them run. It doesn’t give you the full story. Your overhead rate is the pulse of your firm’s profitability, a crucial number that reveals the true cost of doing business. It covers all the essential, non-billable costs that happen behind the scenes to make your client work possible.
Imagine a growing architecture firm that’s landing exciting new projects. The team is buzzing, revenue is climbing, but the profit margins just aren’t matching the effort. Why? Hidden costs are quietly eating away at their success. These are the indirect expenses (your overhead) that don’t get billed to a specific client but are absolutely necessary for the firm to operate.
What actually counts as overhead?
Overhead costs are the unsung heroes of your budget. They cover everything from the physical office space to the administrative tasks that support your billable teams. Without a solid handle on these, you’re essentially flying blind when it comes to pricing.
Common overhead costs in professional services.
Here’s a quick-reference table of the typical indirect expenses you need to be tracking. These are the numbers that will form the backbone of your overhead rate calculation.
| Category | Example Costs |
|---|---|
| Facilities | Office rent, utilities (electricity, water, internet), property taxes, maintenance |
| Administrative Staff | Salaries and benefits for office managers, accountants, HR, marketing coordinators |
| Software & Technology | Subscriptions for CRM, accounting software (like Xero or QuickBooks), design tools |
| Professional Services | Legal fees, accounting services, business insurance, professional association dues |
| Marketing & Sales | Advertising costs, proposal development time, business development travel |
| Office Supplies | General supplies, printing, postage, kitchen amenities |
| Depreciation | Depreciation of office equipment, furniture, and vehicles |
Getting these costs wrong can have a massive impact. A Deloitte survey found that 35% of engineering firms saw their margins shrink due to untracked overhead, eroding up to 15% of their net profits. The Deltek 2025 Professional Services Benchmarks report that architecture and engineering firms carry an average overhead rate of 160%, a figure that has remained remarkably consistent across all firm sizes. You simply can’t price your services for sustainable growth if you don’t know what it truly costs to deliver them.
For firms that need tight financial control, using integrated project management and accounting software is the only reliable way to capture and track these expenses accurately.
Grasping your overhead rate isn’t just an accounting exercise; it’s the most critical step you can take toward making smarter pricing decisions and ensuring your hard work translates into healthy profits.
When you calculate your overhead rate, you turn a long list of abstract expenses into a single, actionable number. This simple percentage empowers you to build proposals that actually cover your costs, evaluate project profitability with confidence, and steer your firm toward a much more secure financial future.
The Core Formulas for Calculating Overhead Rate
Ready to get into the numbers? Calculating your overhead rate isn’t as intimidating as it sounds. It’s a simple division problem that gives you a powerful metric for understanding your firm’s financial health.
Let’s break down the two most effective formulas for professional service firms, minus the confusing jargon.
Every overhead rate calculation needs two key ingredients:
- Total Overhead Costs (the Numerator): This is the sum of all your indirect costs for a specific period: rent, administrative salaries, software, and insurance. It’s everything you spend just to keep the lights on, excluding expenses directly tied to client projects.
- Allocation Base (the Denominator): This is the metric you divide your overhead by. It represents the core driver of your business activity, like total direct labor costs or total direct labor hours.
The formula you choose really depends on what you want to learn. Are you trying to gauge overall firm health, or do you need to set profitable billable rates for your team?
Formula 1: Rate as a percentage of direct labor cost.
This is the go-to formula for a high-level view of your firm’s operational efficiency. It tells you exactly how many cents of overhead you spend for every single dollar of direct labor you pay out. I find this one incredibly useful for annual planning and just getting a gut check on our cost structure.
The formula is straightforward:
Overhead Rate = Total Overhead Costs / Total Direct Labor Costs
Let’s imagine a small consulting firm with $300,000 in annual overhead. Over that same year, the firm paid its consultants a total of $500,000 in direct labor costs for client-facing work.
- Calculation: $300,000 / $500,000 = 0.60
- Result: The overhead rate is 60%. Another way to look at this is as a multiplier of 1.60 (1.0 for the labor + 0.60 for the overhead). It means for every dollar spent on a consultant’s salary for project work, the firm spends an additional 60 cents on overhead just to support them.
Formula 2: Rate per direct labor hour.
When your main goal is setting profitable billable rates, this formula is your best friend. It breaks down your overhead into an hourly cost, revealing the hidden expense baked into every billable hour your team works. This is absolutely essential for accurate project pricing.
Here’s how it works:
Overhead Rate = Total Overhead Costs / Total Direct Labor Hours
Using our same consulting firm, let’s say their team logged 10,000 direct, billable hours over the year. Their overhead is still $300,000.
- Calculation: $300,000 / 10,000 hours = $30 per hour
- Result: The hourly overhead burden is $30. Think about that. If a consultant’s direct pay is $50/hour, their true cost to the firm is actually $80/hour ($50 + $30) before you even think about adding a profit margin.
Ultimately, the best formula comes down to your specific goals. Each one provides a different, valuable perspective on how to manage your firm’s profitability. You don’t have to choose just one. In fact, savvy firm owners often use both. Resources like Complete Controller’s guide to overhead rates in small businesses offer additional context on how different firm sizes approach this decision.
Choosing the Right Allocation Base for Your Firm
The accuracy of your overhead rate hinges entirely on picking the right allocation base, the metric you divide your overhead costs by. Think of it as the foundation of your calculation. If it’s unstable, the whole structure becomes unreliable.
Making this choice confidently is a crucial step toward mastering your firm’s profitability. Your goal is to choose a base that accurately mirrors how your firm operates and, ultimately, makes money. The decision tree below visualizes how your choice can steer you toward either analyzing internal firm health or setting competitive, market-facing billable rates.
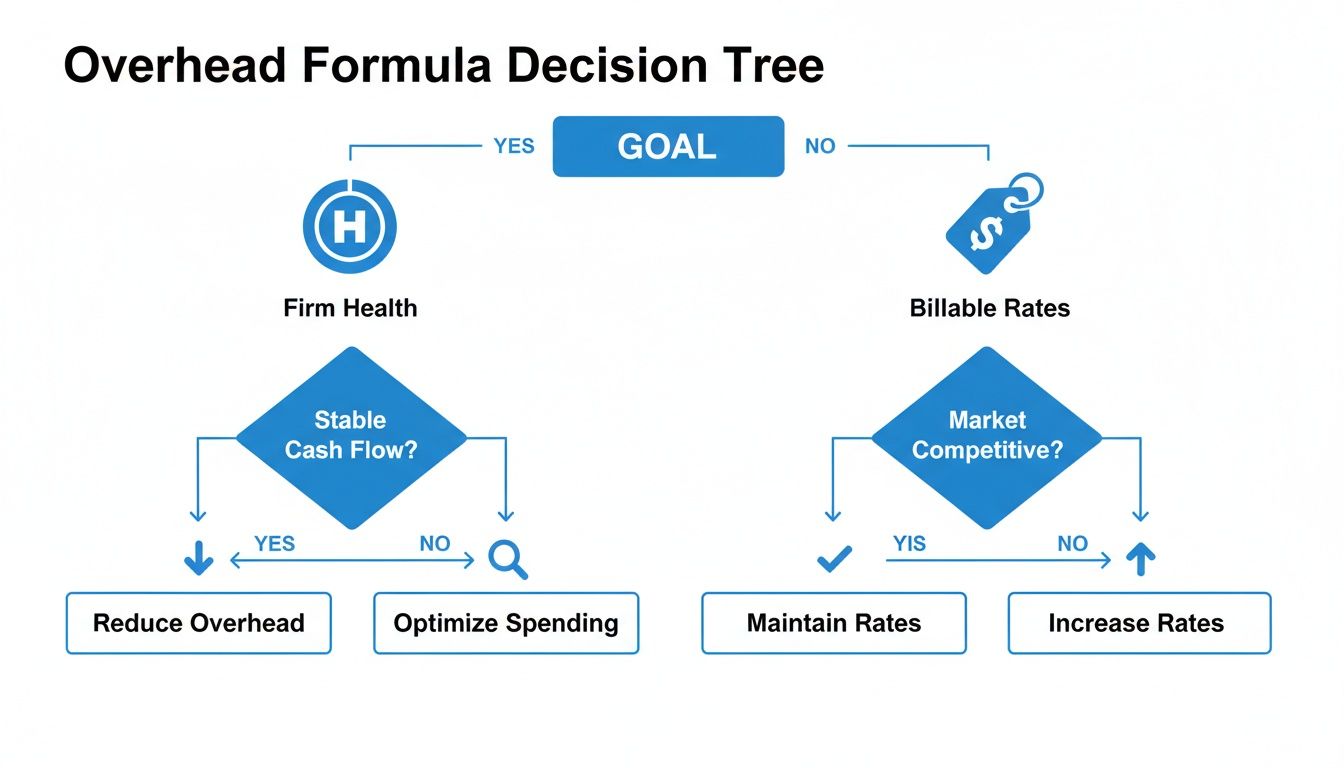
As you can see, the path you take starts right here, with the right formula and allocation base, whether your goal is getting a clear picture of overall profitability or defining a killer pricing strategy.
Direct labor hours.
Using direct labor hours as your allocation base is a fantastic choice for firms where time is the main currency. If most of your team members are on similar pay scales and you bill clients by the hour, this method gives you a clean, straightforward path to your overhead rate.
An architecture firm that primarily bills hourly for drafting and design work would find this method incredibly intuitive. It directly connects overhead costs to the main service they sell: an hour of an expert’s time. The result is a simple overhead cost per billable hour, which is exactly what you need to set profitable rates.
Direct labor cost.
But what if your team has a huge range of salaries? Imagine a marketing agency with junior designers, senior strategists, and highly-paid creative directors all collaborating on the same project. In that world, an hour of one person’s time has a very different underlying cost than another’s.
This is where using direct labor cost as the allocation base shines. It ties overhead recovery to the actual payroll dollars spent on a project, which more accurately reflects how resource-intensive it is. This approach ensures that projects leaning on more senior (and expensive) staff absorb a proportionally larger share of the overhead, giving you a much sharper view of project-level profitability.
The best allocation base is the one that best mirrors your firm’s unique cost structure. There’s no single ‘right’ answer, only the one that gives you the clearest financial picture.
Total direct project costs.
Sometimes, labor isn’t the biggest piece of the project puzzle. Think about a construction management or engineering firm that deals with significant pass-through expenses, like massive subcontractor fees or hefty material costs. If these direct, non-labor costs make up a huge chunk of your project budgets, then total direct project costs might be the best fit.
This method spreads overhead across all direct costs linked to a project, not just labor. It provides a more holistic view when labor is just one of many major expenses. A word of caution, though: if your material or subcontractor costs swing wildly from one project to the next, this method can sometimes distort your overhead allocation, making some labor-intensive projects look more profitable than they actually are.
To help you decide, let’s break down the options. Picking the right allocation base isn’t just a technical step; it’s a strategic decision that shapes how you understand your business’s performance.
Which allocation base should you use?
| Allocation Base | Best For | Pros | Cons |
|---|---|---|---|
| Direct Labor Hours | Service-based firms with similar staff pay rates, where billing is primarily hourly. | Simple to calculate and easy to understand. Directly links overhead to billable time. | Can be misleading if staff salary ranges are wide, as it treats every hour equally. |
| Direct Labor Cost | Firms with diverse roles and significant salary variations (e.g., junior vs. senior staff). | Accurately reflects the true cost of labor resources on a project. Better for profitability analysis. | Requires precise payroll data. Can be more complex to track than just hours. |
| Total Direct Project Costs | Firms where non-labor costs (materials, subcontractors) are a major part of project budgets. | Provides a comprehensive view by including all direct project expenses. | Can distort overhead allocation if non-labor costs are highly variable between projects. |
Ultimately, the key is to select the metric that most logically and consistently drives your firm’s indirect expenses. No matter which you choose, accurately tracking these metrics is fundamental. This is why integrated time tracking and expense software is so valuable. It captures the clean, reliable data needed to make any of these methods work for you.
Calculating Overhead Rates with Real-World Examples
Theory is one thing, but seeing the numbers in action is where it all clicks. Let’s walk through a few friendly, practical examples to show you exactly how to calculate your overhead rate, step by step.
Example 1: The small marketing agency.
Imagine a boutique marketing agency with a small, talented team. To get a handle on their overall financial health for the year, they want to calculate their overhead rate as a percentage of their direct labor costs.
Step 1: Add Up All Overhead Costs First, they gather all their indirect expenses for the past 12 months:
- Office Rent: $36,000
- Utilities & Internet: $6,000
- Software Subscriptions (CRM, design tools): $12,000
- Office Manager Salary: $55,000
- Marketing & Advertising: $10,000
- Insurance & Professional Fees: $5,000
- Total Overhead Costs = $124,000
Step 2: Calculate Total Direct Labor Costs Next, they add up the annual salaries for all the employees who work directly on client projects (designers, copywriters, strategists).
- Total Direct Labor Costs = $250,000
Step 3: Apply the Formula
Now, they use the formula: Total Overhead Costs / Total Direct Labor Costs
- Calculation: $124,000 / $250,000 = 0.496
- Result: Their overhead rate is 49.6%.
This friendly number tells them that for every dollar they spend on a creative team member’s salary, they spend an additional 49.6 cents on the support structure needed to make that work happen.
Example 2: The engineering firm’s hourly rate.
Now let’s look at a mid-sized engineering firm. Their main goal is to set profitable and competitive billable rates for their engineers. For this, calculating the hourly overhead rate is the perfect tool.
Step 1: Tally the Overhead Their total indirect costs for the year are:
- Total Overhead Costs = $400,000
Step 2: Find the Total Billable Hours They look at their time tracking data and find that their team of engineers logged a combined total of billable hours on client projects.
- Total Direct Labor Hours = 8,000 hours
Step 3: Do the Math
They use the formula: Total Overhead Costs / Total Direct Labor Hours
- Calculation: $400,000 / 8,000 hours = $50 per hour
- Result: Their hourly overhead burden is $50.
This is a critical insight for pricing. If an engineer’s direct pay rate is $75 per hour, the firm knows their true cost for that engineer is actually $125 per hour ($75 + $50) before even adding a profit margin. Armed with this insight, they can confidently price their services to ensure every project is profitable.
Common Pitfalls When Calculating Overhead and How to Avoid Them
Knowing the formulas is a fantastic start, but the real world of business accounting is filled with little traps that can easily throw off your numbers. When your overhead rate is inaccurate, it poisons everything from your pricing and profit margins to your biggest strategic decisions.
Let’s walk through some of the most common pitfalls I’ve seen trip up even the sharpest firm owners. More importantly, we’ll cover how you can sidestep them to build a reliable, repeatable process for calculating your overhead rate.
Misclassifying hybrid roles.
One of the most frequent mistakes I see is the misclassification of employee time, especially for roles with blended responsibilities. Think of a project manager or a principal architect. They might spend 60% of their time on billable client work, but the other 40% is spent on essential non-billable tasks like business development, mentoring staff, or general admin.
If you classify their entire salary as overhead, you’re artificially inflating your indirect costs. On the flip side, if you treat them as 100% direct labor, you’re not accounting for the true overhead needed to support your firm. Either way, your numbers are wrong.
- How to Avoid It: The solution is meticulous time tracking. Your team has to log hours against specific projects and distinct overhead categories (like “Admin” or “Business Development”). This is the only way to get the precise data needed to split salaries accurately between your direct and indirect cost buckets.
Relying on outdated data.
Using last year’s overhead rate to price this year’s projects is like driving while only looking in the rearview mirror. Your costs are constantly changing. Rent goes up, you hire new admin staff, your software subscriptions get more expensive. Sticking with old numbers is a direct path to underpricing your services and watching your profits disappear.
Your overhead rate is a living number, not a “set it and forget it” metric. It reflects the current financial reality of your business, and it needs to be updated regularly to be useful.
Make calculating your overhead rate a regular financial hygiene practice—at a minimum, do it quarterly. A monthly check-in is even better, especially if your firm’s costs tend to fluctuate. This ensures your proposals are always based on what it actually costs to run your business today.
Forgetting the hidden costs.
It’s easy to remember the big-ticket items like rent and administrative salaries. But what about the smaller, “hidden” overheads that quietly add up? These are the expenses that often get missed, and they can significantly skew your final calculation.
We’re talking about things like:
- Non-billable training and professional development time.
- Bank fees and interest on business loans.
- Depreciation on all that office equipment and your team’s computers.
- The cost of preparing proposals for jobs you didn’t even win.
It might seem small, but it adds up. A recent PwC study highlighted that a staggering 42% of firms misprice projects because their flat rates don’t account for these variables, slashing their margins by 10-15%. Globally, digital agencies typically report 25-30% overhead on billables, a target that’s impossible to hit if you’re not tracking every single indirect cost. The 2025 SPI Professional Services Maturity Benchmark underscores the stakes: average EBITDA margins have fallen to just 9.8%, the lowest in five years, while the top income statement KPIs for professional services firms emphasize that overhead rate is one of the three most critical metrics for gauging firm health.

If you’re still wrestling with spreadsheets to figure out your overhead rate, you know the frustration. It’s a manual, time-consuming process that often feels like you’re trying to assemble a puzzle with missing pieces. Thankfully, there’s a much better way.
Modern software can transform this chore into a genuine strategic advantage. The right platform automates the entire process by bringing all the essential data points into one unified system.
The power of a single source of truth.
Imagine your team logging their hours directly to either a client project or a specific overhead category like “Business Development” or “Admin.” At the same time, every indirect expense, from software subscriptions to office rent, is captured in the same place.
This is the core idea behind Professional Services Automation (PSA). These platforms connect the dots for you, eliminating the need to manually export data from one system and import it into another. When your time tracking, expense management, and project accounting all live together, the data is always clean, current, and reliable.
This isn’t just about saving a few hours at the end of the month. It’s about gaining the clarity you need to make proactive, confident decisions about your firm’s future.
An automated system gives you a real-time dashboard of your firm’s financial health. You can stop looking in the rearview mirror and start steering your business with forward-looking insights.
From crunching numbers to leading your firm.
When you automate how you calculate your overhead rate, you unlock a new level of strategic control. Suddenly, you have instant answers to critical questions that were once buried in spreadsheets:
- Is this project actually profitable? Compare real-time labor costs and overhead against the budget.
- Are our billable rates high enough? See your true cost per hour, including the overhead burden.
- Where are our overhead costs creeping up? Spot trends in spending before they become major issues.
This shift empowers you to move from being reactive to proactive. Instead of spending your valuable time crunching numbers, you can focus on what really matters: analyzing the data, refining your pricing strategy, and leading your firm toward more profitable growth. The right tools make all the difference.
Ready to see how all this actually works in a real firm?
Drum can lead your firm toward more profitable growth
Start your free 14-day trial and discover a better way to run your studio.